Production Tracing Datadog Hooks Into Android 15
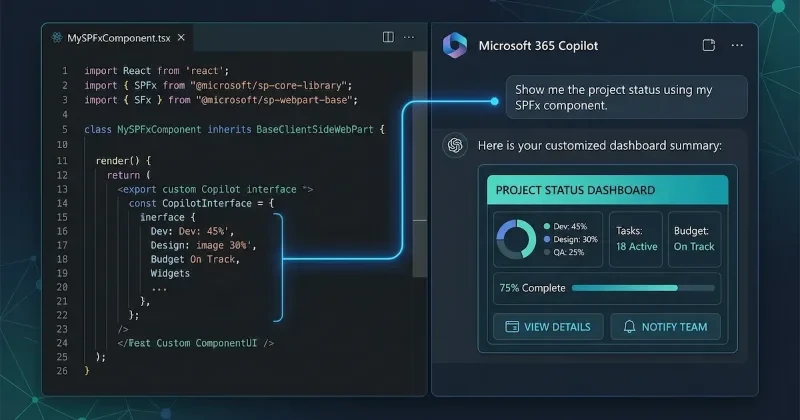
We have all been there production signals flag a sudden spike in Application Not Responding (ANR) rates, but your local reproduction attempts yield absolutely nothing. Pinpointing the exact line of code causing real-world mobile slowdowns has historically meant guessing, adding custom logging, and hoping for the best. We have been watching the rollout of Android 15 closely, and a major new collaboration shows how platform-level changes are finally solving this visibility gap. Datadog has integrated Android 15's native Profiling Manager API directly into its Real User Monitoring (RUM) framework.
Summary
Datadog announced a major upgrade to its mobile observability pipeline by integrating the native Profiling Manager system service introduced in Android 15. Announced via Google's developer channels, the partnership allows Datadog to programmatically collect high-fidelity production data-including call stack samples, heap dumps, and system-level traces-directly from active user environments.
According to internal data from June 2026, the updated SDK is already scaling across millions of active devices worldwide. Historically, Datadog’s RUM capabilities focused primarily on high-level session telemetry, tracking metrics like network latency, CPU load, and frozen frames. While these indicators proved useful for mapping the user journey, they failed to point developers directly to the problematic lines of code causing performance drops.
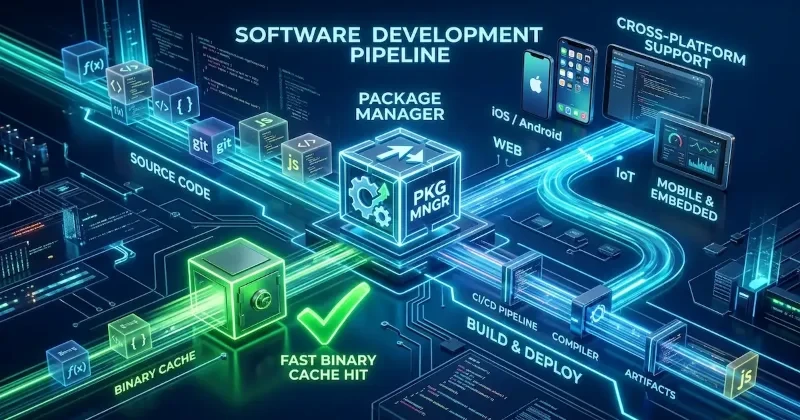
To overcome this, Datadog worked with Google to hook into the OS-level ProfilingManager API. This approach allows the Datadog SDK to trigger automatic trace snapshots using native system events. The initial deployment targets the APP_FULLY_DRAWN signal to analyze launch sequences, with plans to expand into automated triggers for ANR, Out-of-Memory (OOM), and cold-start regressions.
By offloading trace processing and sampling logic directly to the operating system, the integration avoids the heavy runtime overhead usually associated with production profiling. On-device data controls also ensure that data from unrelated background processes is stripped out before delivery, optimizing file sizes and protecting user privacy.
Developers
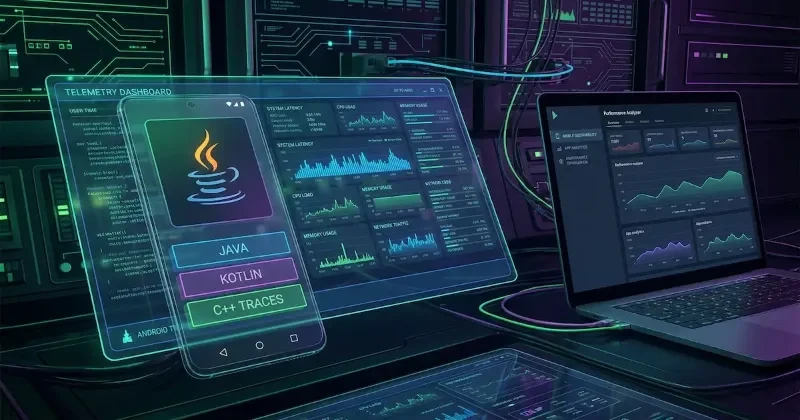
If you are shipping production Android applications, this integration shifts your debugging workflow from reactive guesswork to proactive field analysis. Instead of relying on vague crash logs or user tickets, you get direct visibility into Java, Kotlin, and C++ traces right when an error occurs.
For teams running SaaS apps or consumer products, this means you can pinpoint hidden scheduling bottlenecks-like background threads hogging the device’s highest-performing big CPU cores during startup-without degrading user experience. You can also download these high-fidelity profiles straight from your dashboard and drop them into visualization tools like the Perfetto trace analyzer UI for granular, frame-by-frame inspection.
Our Analysis
We think this is a massive win for the mobile development community. For years, mobile profiling has been a major blind spot compared to backend services, where APM tools regularly provide deep flame graphs on production servers. By baking profiling primitives directly into the Android OS, Google is making production-scale performance tracking a viable standard rather than a hazardous luxury that tanks device frames.
We predict this move will force other major observability players, like New Relic and Dynatrace, to rapidly update their mobile SDKs to hook into ProfilingManager. If they don't, they risk losing serious ground to Datadog in the enterprise mobile ecosystem. Furthermore, as Datadog highlights plans to use this structured trace data as clean inputs for autonomous AI coding agents, we are moving toward a future where performance regressions are not just detected in production, but automatically patched via automated pull requests
| Capability | Previous Datadog RUM Setup | New Android 15 Integration |
| Data Scope | Session telemetry & high-level health | OS-level call stacks & memory heap dumps |
| Trace Visibility | Frozen frames, latency, & CPU load | Java, Kotlin, and C++ code-level traces |
| Performance Overhead | Minimal, but limited to basic event logging | Negligible; sampling offloaded to Android OS |
| Trigger Mechanism | Manual logging / post-event diagnostics | Native system signals (<code>APP_FULLY_DRAWN</code>) |
While Datadog manages this via their proprietary SDK, you can interface with the system service directly in Android 15+ environments to request an on-demand trace snapshot.
import android.os.ProfilingManager
import android.content.Context
import java.util.concurrent.Executors

// Initialize and request an on-demand profiling trace using the Android 15 API
fun triggerSystemTraceSnapshot(context: Context) {
    // Fetch the system-level Profiling Manager service
    val profilingManager = context.getSystemService(Context.PROFILING_SERVICE) as? ProfilingManager

    if (profilingManager != null) {
        // Define an executor to handle the asynchronous trace processing payload
        val executor = Executors.newSingleThreadExecutor()

        // Request a specific profiling type (e.g., CPU_SAMPLING or JAVA_HEAP_DUMP)
        profilingManager.requestProfiling(
            ProfilingManager.PROFILING_TYPE_CPU_SAMPLING,
            null, // Optional metadata bundle tags
            null, // Optional file descriptor override
            executor
        ) { result ->
            // Callback executed once the OS finishes filtering and packages the profile
            if (result.status == ProfilingManager.STATUS_SUCCESS) {
                // Your trace file is ready to be safely dispatched to your telemetry backend
                val tracePath = result.path
                println("Profile successfully captured at: $tracePath")
            }
        }
    }
}
FAQs
Q: What Android versions support the new Profiling Manager API?
A: The ProfilingManager system service is introduced natively in Android 15 and above. Devices running older versions of the operating system cannot utilize these OS-level sampling hooks.
Q: Does running production profiling drain user device resources or tank frame rates?
A: No. Because the API offloads sampling frequency and scheduling decisions entirely to the underlying operating system, the runtime overhead remains negligible and unnoticeable to the end-user.
Q: What languages are supported by the trace diagnostics?
A: The system provides deep, granular visibility across multiple development tiers, capturing code-level call stack traces for Java, Kotlin, and native C++ execution.
Q: Can I view these trace files outside of the Datadog ecosystem?
A: Yes. The generated profiles are fully compatible with open standards, allowing developers to download the raw trace files and review them inside Google's web-based Perfetto trace analyzer UI.
Our Take
Datadog's integration of the Android 15 Profiling Manager bridges a frustrating chasm between mobile diagnostics and backend visibility. By giving engineering teams a low-overhead window into real-world code execution, speculative trial-and-error debugging is officially on its way out. We're keeping a close eye on how this native telemetry paradigm evolves as automated tooling begins to parse these deep profiles. Stay tuned to Devignitor as we track the next wave of API-driven performance tools.