NET Aspire VS Code Tighten Your Dev Loop
You are spinning up a backend API, a React frontend, a Python worker, and a Redis container. Five minutes later, you are staring at a chaotic mess of terminal tabs trying to figure out which microservice crashed. We’ve been watching the development of .NET Aspire closely, and its latest 13.4 release targets this exact pain point. By introducing a dedicated Visual Studio Code extension, Microsoft is officially bringing its cloud-native orchestration tool directly into the lightweight editor where so many of us spend our day.
Summary
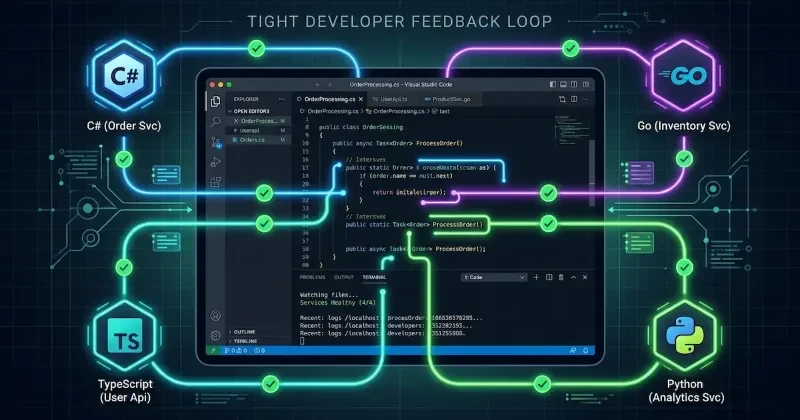
Microsoft has launched the .NET Aspire VS Code extension for version 13.4, fundamentally tightening the local development loop for distributed applications. The extension hooks directly into the Aspire CLI to orchestrate, run, and debug complex multi-service architectures from a single instance of VS Code.
A major highlight of this release is expanded multi-language debugging. When you launch an AppHost, the extension automatically attaches debuggers to C#, TypeScript/JavaScript, Python, and Go resources. Go hosting receives first-party status in this update via dlv-dap support.
The extension also introduces a highly visual interface directly inside the code editor. CodeLens actions and gutter icons now display real-time health check statuses right next to your resource declarations. You can restart an individual service, view isolated logs, or open the dashboard directly from your AppHost configuration file. Additionally, the TypeScript AppHost has officially reached General Availability (GA) in version 13.4, allowing developers to manage their orchestration layer using apphost.mts files with full extension support.
Developer Impact
For developers building microservices or AI-driven multi-agent applications, this release removes massive operational friction. Instead of maintaining a complex launch.json file with dozens of compound tasks to attach debuggers to individual services, a single configuration block of type: "aspire" handles the entire cluster.
If you are shipping a SaaS product with a mixed tech stack-like a fast Go API paired with a Next.js frontend-you can use the WithBrowserDebugger method to automatically launch a debug-connected browser session as soon as the frontend resource signals it is healthy. The addition of typed arguments for custom commands means you can also prompt for secrets or environment variables directly inside the VS Code command palette before executing pipeline steps.
Our Analysis
This is a massive win for the developer community, particularly for indie hackers and team leads who prefer the speed of VS Code over Visual Studio. Historically, .NET tooling has felt second-class outside of Microsoft’s flagship IDE. By bringing deep, health-aware orchestration to VS Code, Microsoft is proving that Aspire is not just a marketing wrapper for .NET, but a legitimate competitor to Docker Compose for local development.
We predict this will significantly accelerate the adoption of Aspire among frontend and polyglot developers. The GA release of the TypeScript AppHost proves Microsoft is serious about capturing ecosystems outside of traditional C# shops.
Comparing this to version 13.3, the workflow is much less disruptive. Previously, launching an Aspire app forced open a new browser tab for the Aspire Dashboard every single time. In 13.4, that automatic launch is turned off by default. Instead, the dashboard remains one click away via CodeLens or can be embedded directly into VS Code’s side panel using the integratedBrowser setting. This keeps your focus locked entirely on the code
Setting up your environment requires a single, minimal debug profile in your .vscode/launch.json file.
{
  "version": "0.2.0",
  "configurations": [
    {
      "type": "aspire",
      "request": "launch",
      "name": "Aspire: Launch default AppHost",
      // Points to the root workspace containing the AppHost project
      "program": "${workspaceFolder}"
    }
  ]
}
FAQs
Q: How do I install the Aspire CLI for this extension?
A: You can install it directly within VS Code by opening the Command Palette and running the > Aspire: Install Aspire CLI (stable) command after installing the extension.
Q: Does the extension support languages other than C#?
A: Yes, it natively orchestrates and debugs C#, TypeScript, JavaScript, Python, and Go resources, with Java support planned for later in 2026.
Q: Can I view resource logs without opening the full Aspire Dashboard browser tab?
A: Yes, the 13.4 extension features CodeLens actions and an Aspire Panel that let you view logs and check resource health right inside the IDE.
Our Take
The .NET Aspire 13.4 update successfully bridges the gap between lightweight text editing and heavy-duty cloud-native orchestration. By eliminating context-switching between the terminal, browser, and editor, Microsoft has built a highly efficient local development loop. We will be keeping a close eye on how the platform evolves as more languages enter the ecosystem later this year.